.jpg)
Usua U. Amanam, Ph.D.
August 24, 2026
Summary of Part 2. In Part 1, we discussed why copper’s demand-side dynamics appear favorable for early-stage investment. We made the case that a diversified buyer base will soon face an increasing shortfall, one amplified by the complexity of substitution and a growing trend in usage. In Part 2, we highlight long-known, persistent supply-side trends that limit the ability of stakeholders to respond to industry needs. We show that while new mine (“greenfield”) developments are required, miners’ existing capital allocation strategies create a significant opportunity at existing mine sites (“brownfield”) to grow the economically mineable ore base (“reserves”) and maintain or increase production. Brownfield sites, however, are not without their own challenges. The productivity gains that have helped miners maintain operational profitability of their long-lived assets over the years have since ceased. That carries negative implications for supply but creates an opportunity for novel solutions. We conclude by highlighting the critical role innovation has historically played in unlocking capacity at brownfield sites, paving the way for a forthcoming final article that analyzes how venture capital can support this industry through investment.
Copper projects have become harder to develop over the decades, subjecting miners to increasing risk. The declining success rate of greenfield exploration has been discussed at length in several publications. In general, it is due to “increasing political, regulatory, and tax issues,” which restrict the total area that can be reasonably developed and thus explored. In combination with “declining grades, rising costs . . . as well as the difficulties of exploring [deeper]", it has led to a dearth of top-tier deposits entering the development pipeline (Schodde, 2025). The preceding quotes are well-suited for the 2026 copper market; however, they reflect comments made by industry observers 15+ years ago during the last period of sustained, elevated commodity prices (“supercycle”). Since then, top-tier deposits, which generate the bulk of the value associated with exploration activities, have accounted for less than 3% of all significant discoveries (Schodde, 2026). Greenfield exploration has always been a challenging business, though, one whose difficulties drove large mining companies away from it in the 1980s. For context, an analysis of 100 of the most significant mines to come online from 1989-2008 models and estimates that the median IRR of exploration activities was below the industry’s average cost of capital1 (Doggett and Leveille, 2010). And, in a separate and more recent study, researchers showed that between 1997 and 2020, the expected returns for copper exploration, on average, were negative (Castillo & Roa, 2026). This is despite a steady stream of innovations introduced across drilling, geochemistry, geophysics, and other areas during these periods. It remains to be seen whether the newest technologies, such as agentic and generative AI, can avoid being just another helpful advancement and instead have a paradigm-shifting effect on exploration similar to that of airborne electromagnetic geophysics and new geologic models for porphyry systems (Schodde, 2025).
While we believe that new exploration technologies will improve discovery rates and expand the project pipeline more quickly, we argue that most new deposits will still have to contend with the realities of post-discovery development timelines. The discovery-to-mine conversion rate has generally slowed across project vintages since the 1950s (MinEx Consulting, 2026). One primary driver is increased project complexity, which inherently increases unit costs (BHP, 2024). The growth of project complexity follows the natural trajectory of resource extraction: easier-to-mine deposits are exploited first and depleted, ultimately driving stakeholders to pursue harder-to-mine zones or sites. Chuquicamata is a good example, showing this evolution at a single site, but there are others (Bloomberg, 2024). Longer lead times and increased unit costs mean lower IRRs for (prospective) projects, all else equal, increasing the riskiness of development and reducing the appetite to pursue these more complex assets.
Figure 1 and Figure 2 illustrate this increased post-discovery risk through schedule delays and rising development costs. Figure 1 is part of a 2024 McKinsey analysis that shows copper projects carrying higher levels of execution risk when compared to other metals; roughly one-third experienced delays of more than 30% (McKinsey, 2024). We view schedule delay as a distinct, albeit compounding, risk factor to the long development timelines previously discussed. Delays cause deviation from a baseline underwriting case, negatively impacting project economics, and leading to potential suspension or abandonment. Occam Edge’s database of more than 900 energy and industrial infrastructure projects, which includes ~10 major copper mines brought to FID since 2012, shows how delays are associated with increased cost overruns, relative to a base case. Residual damage from failed or underperforming efforts can color subsequent decision-making for projects, exacerbating the problem.
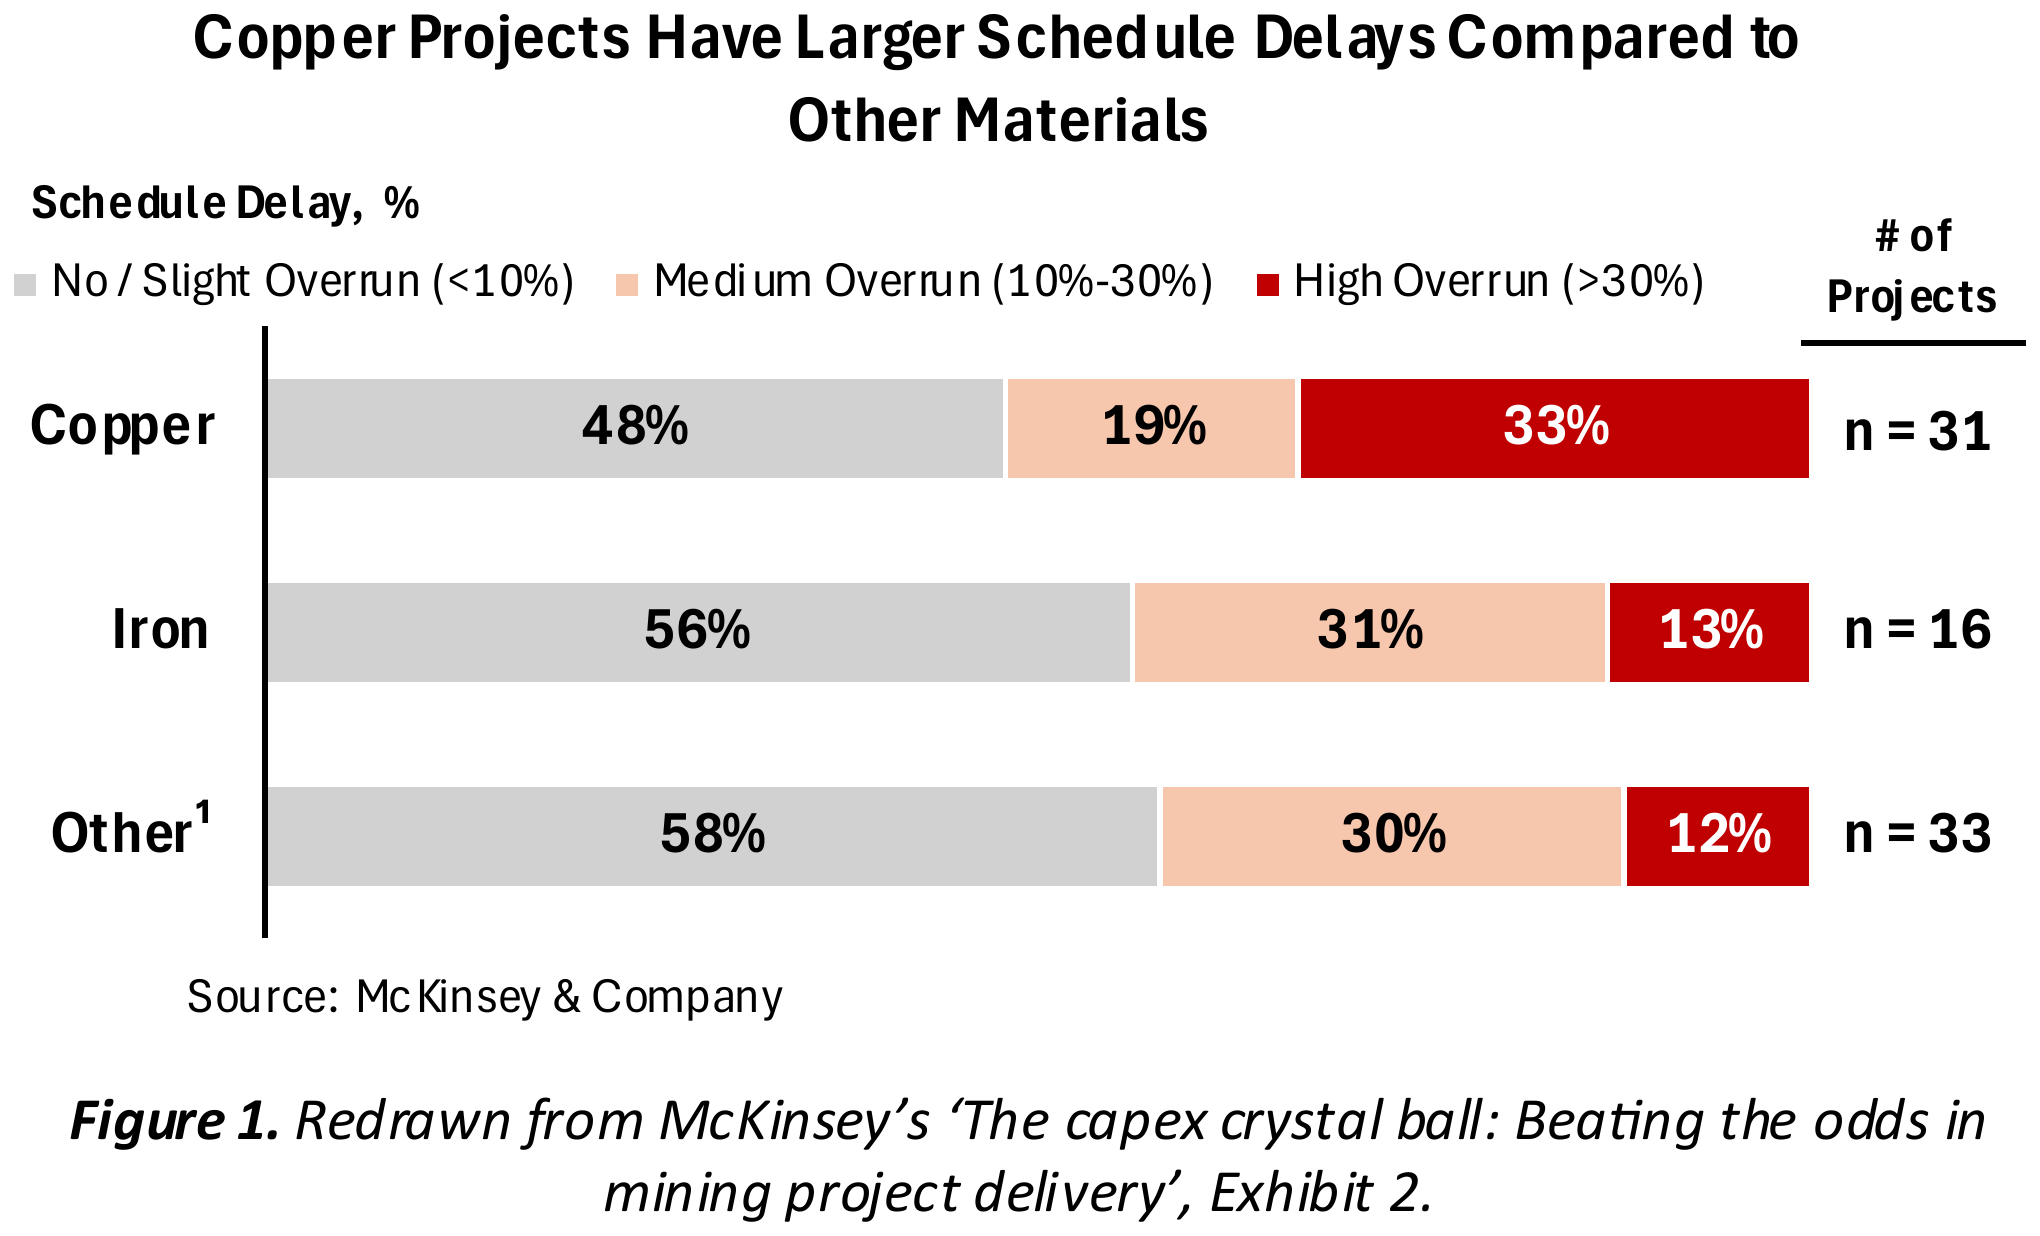
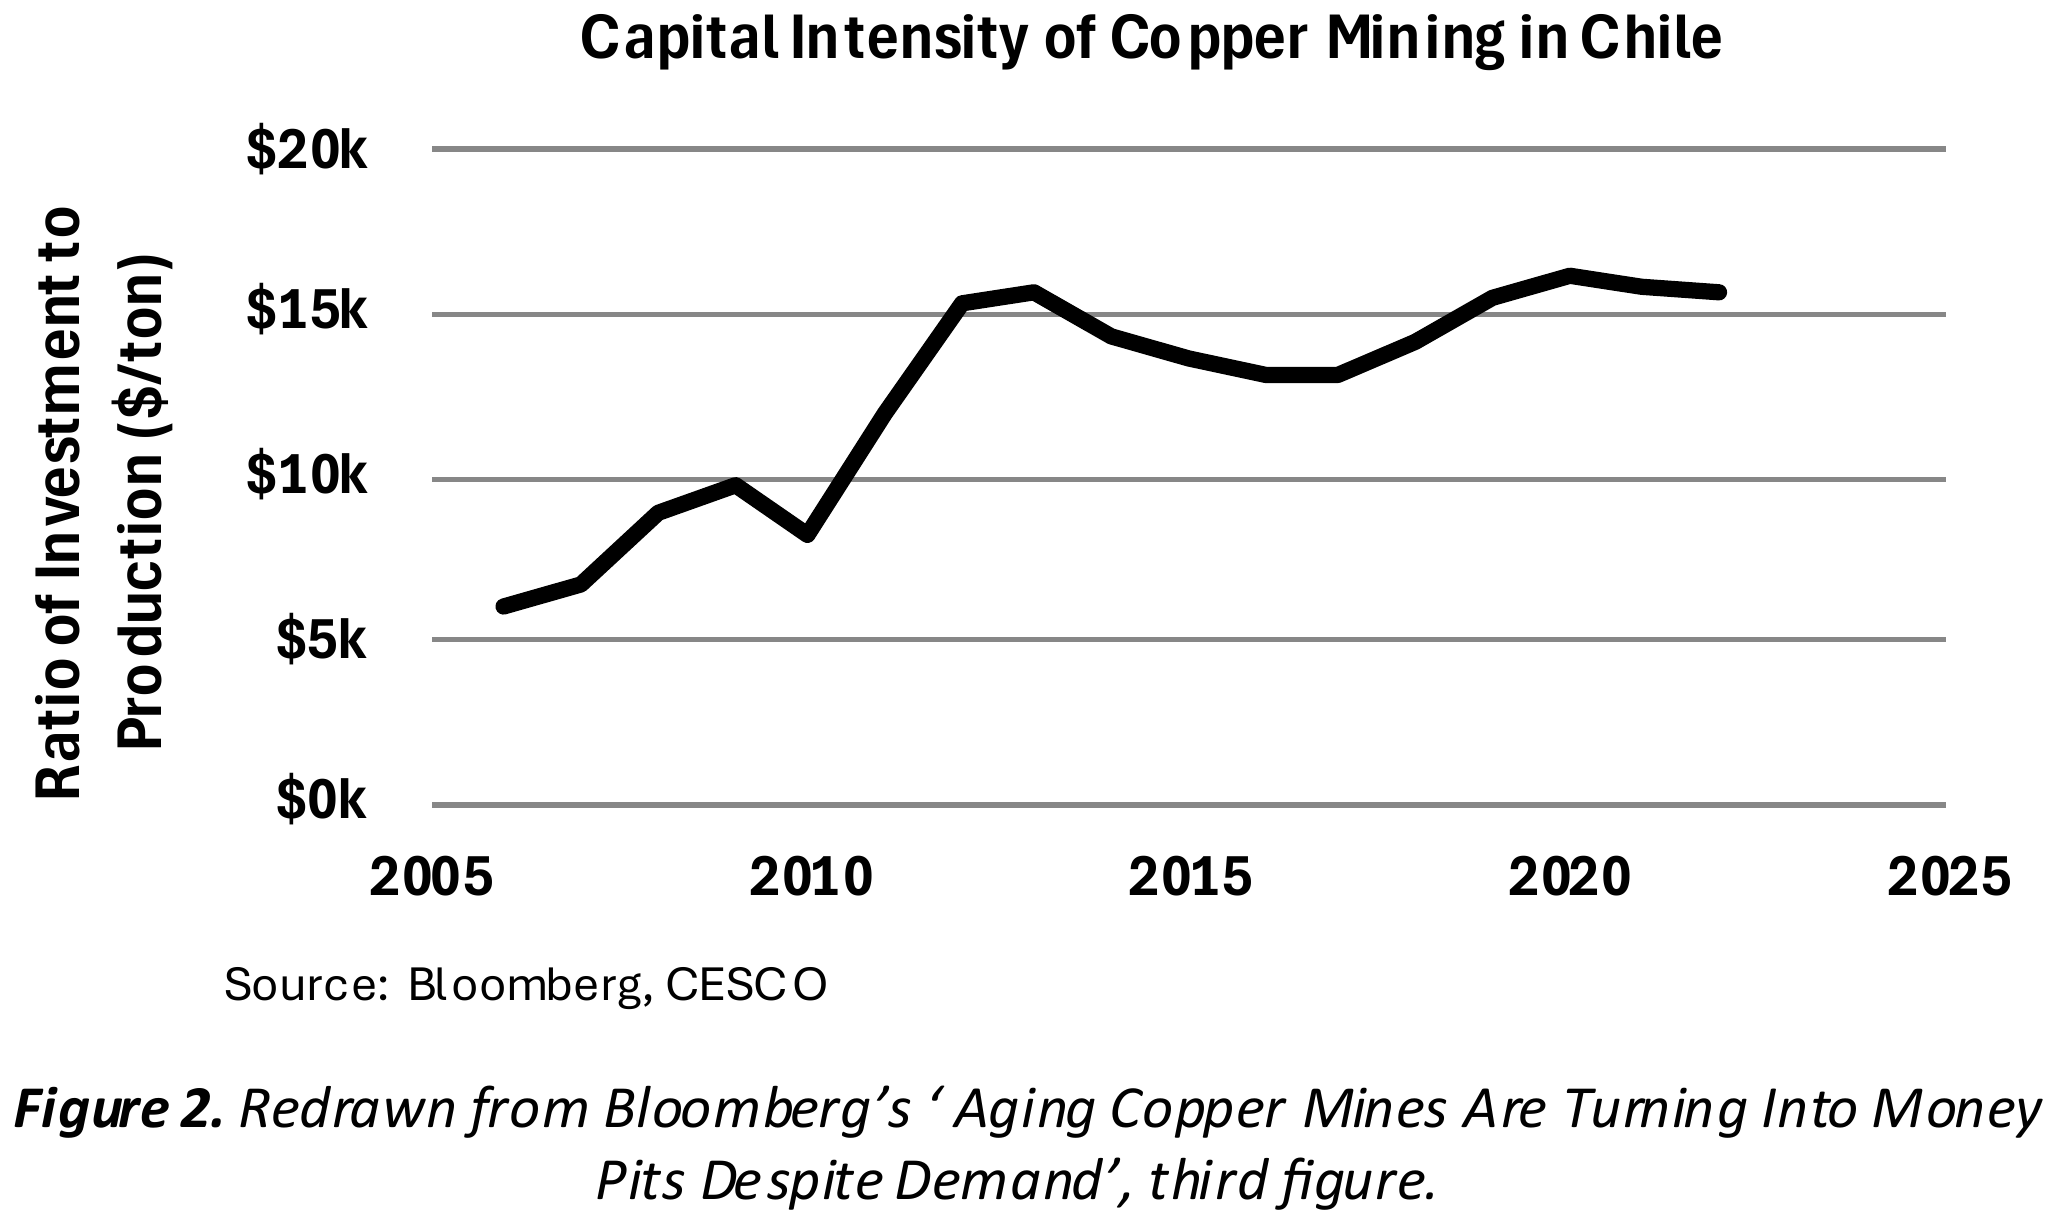
Figure 2 shows rising development costs in Chile, the world’s largest copper-producing and reserves-bearing country. This phenomenon, however, is not unique to the country, and multiple industry stakeholders, including BHP, have further discussed the trend (BHP, 2024; S&P Global, 2025a; Miningmx, 2025).
An important contributing factor to all of this is the environmental, social, and governance (“ESG”) requirements that miners increasingly must meet. The capital associated with it can be hard to quantify, but the impact on development and operations is well understood. Of the ~90 copper projects recently analyzed by MinEx Consulting, nearly a quarter were stalled due to environmental and/or social reasons, outpacing those delayed due to poor economics (MinEx Consulting, 2026). The term ‘social license to operate’ is now commonly used across the industry to refer to the informal, ongoing approvals miners must secure from local communities to operate, and it is largely informed by ESG factors (OXFAM, 2025). One specific area where this repeatedly and increasingly arises is water usage. In our own analysis of ~15 prominent copper mines4, we see a common theme: businesses are spending additional capital to respond to calls and/or requirements to improve water stewardship or alleviate constraints. This includes i) creating one of the larger desalination plants globally (Escondida), ii) using 100% untreated seawater for operations in lieu of freshwater withdrawals (Centinela), and iii) achieving >95% water reuse (Las Bambas). These new ESG-focused efforts increase costs and risks for new and existing projects, but are, rightfully, part of the cost of doing business.
Miners have pursued brownfield strategies as they aim to maintain capital discipline. Increased risk means that the forecasted returns required to greenlight a project must rise (“hurdle rate”) to compensate the miner for a higher probability of loss. While we have not yet seen a study that shows this occurring over time in a given portfolio, industry anecdotes from individuals such as David Humphreys, former Chief Economist at Rio Tinto and Norilsk Nickel, point to changes to capital allocation strategies as an indicator of such a phenomenon: more capital is being assigned to brownfield projects, as it is considered easier to meet hurdle rates when expanding or extending the life of an asset a mining company already knows. This is particularly relevant today, as talk of a new supercycle becomes more frequent. Those that experienced investment-related economic pain during the previous one have spent the last decade prioritizing capital discipline and operational excellence. Wood Mackenzie analyzed a set of copper-focused and diversified miners responsible for ~50% of global production, and found that between 2019 and 2024, ~80-95% of capital allocated after dividends and share buybacks went to sustaining capex and brownfield expansion (Wood Mackenzie, 2025). Even funds earmarked for exploration are increasingly used at existing sites2. Brownfield budgets have steadily grown in size relative to greenfield ones, and, in 2025, reached a ratio of ~1.75 to 1 (S&P Global, 2025b; S&P Global, 2026). Three recent examples further show the industry’s strong focus on maximizing the value of existing assets: (i) CODELCO, which is amongst the largest copper producers globally, believes “supply expansion will largely depend on brownfield projects, as new greenfield developments face increasing challenges (CODELCO, 2025),” (ii) ~80% of investment dollars in the 2024-2033 Chilean project portfolio are allocated to brownfield efforts (ITA, 2025), and (iii) BHP “expect[s] high-quality brownfield projects to be prized in the industry in the face of growing copper demand” and that “the experience, technical capability developed through years of production and detailed ore body knowledge remain as major advantages, particularly when it comes to more complex projects (BHP, 2024)”. As a final point, we believe the shift in allocation drives a feedback loop that only increases the importance of brownfield sites, with new research showing that exploration budgets are the dominant determinant of the frequency and quality of discoveries (Castillo & Roa, 2026).
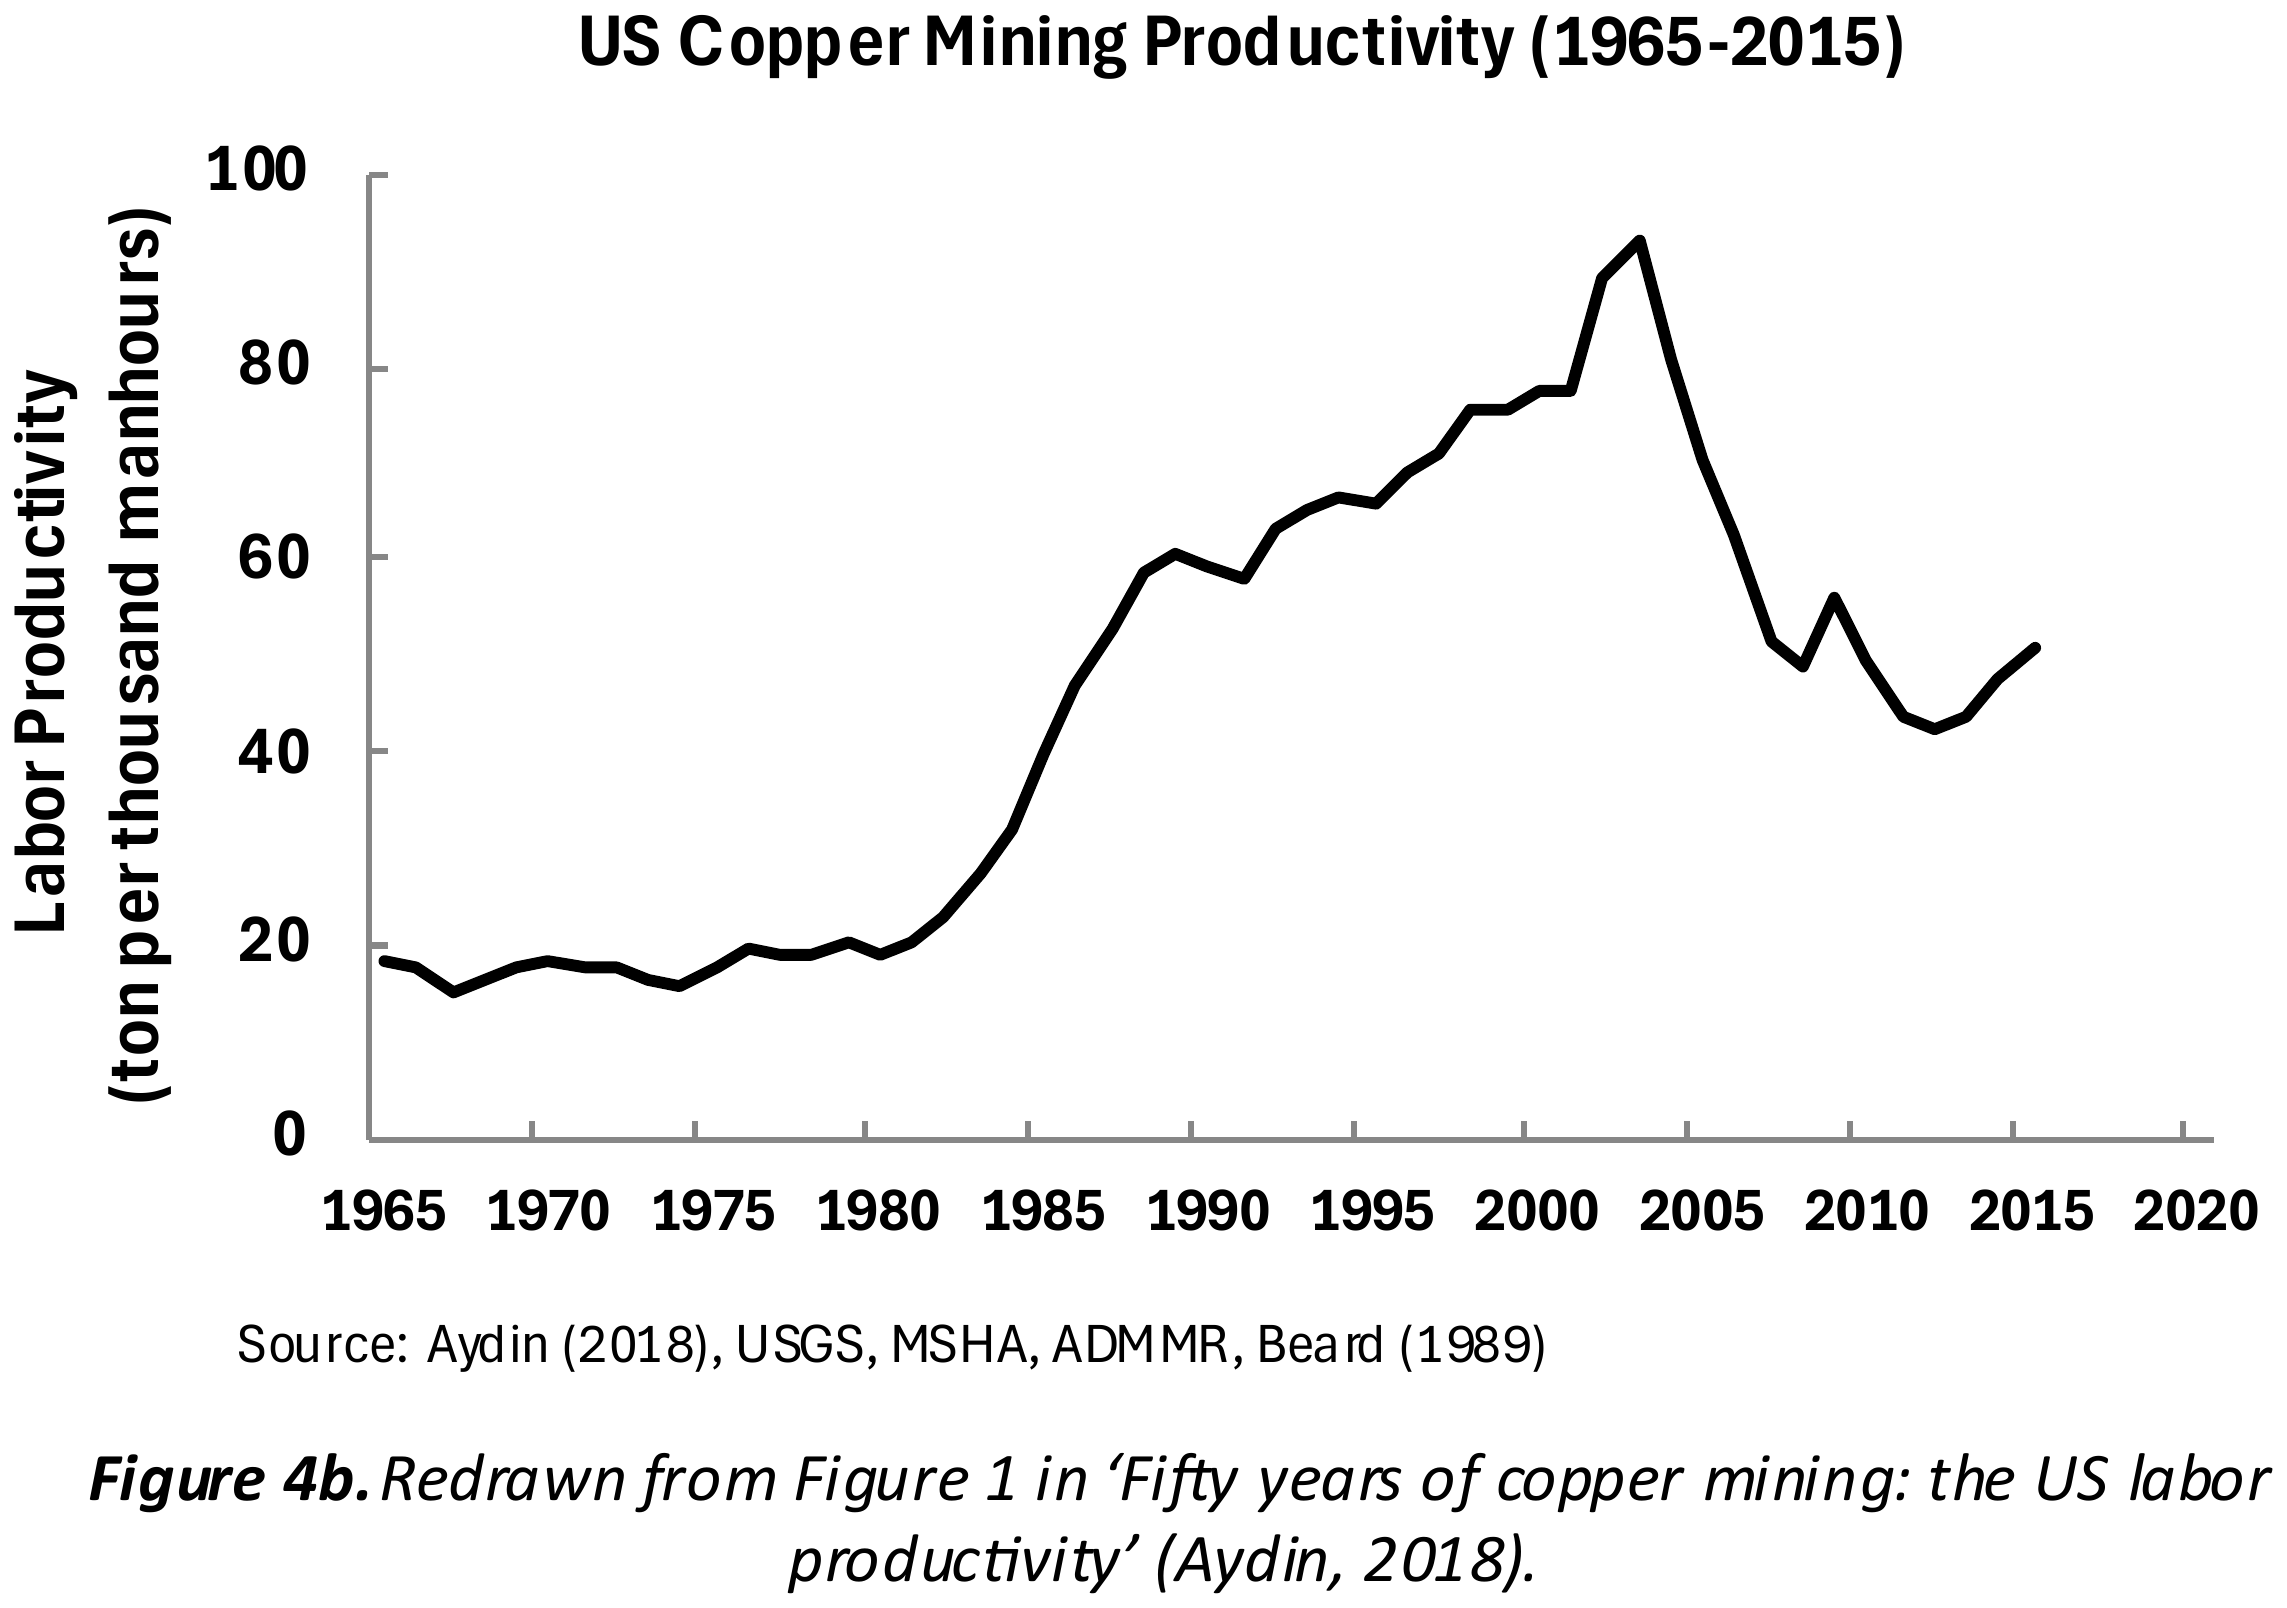
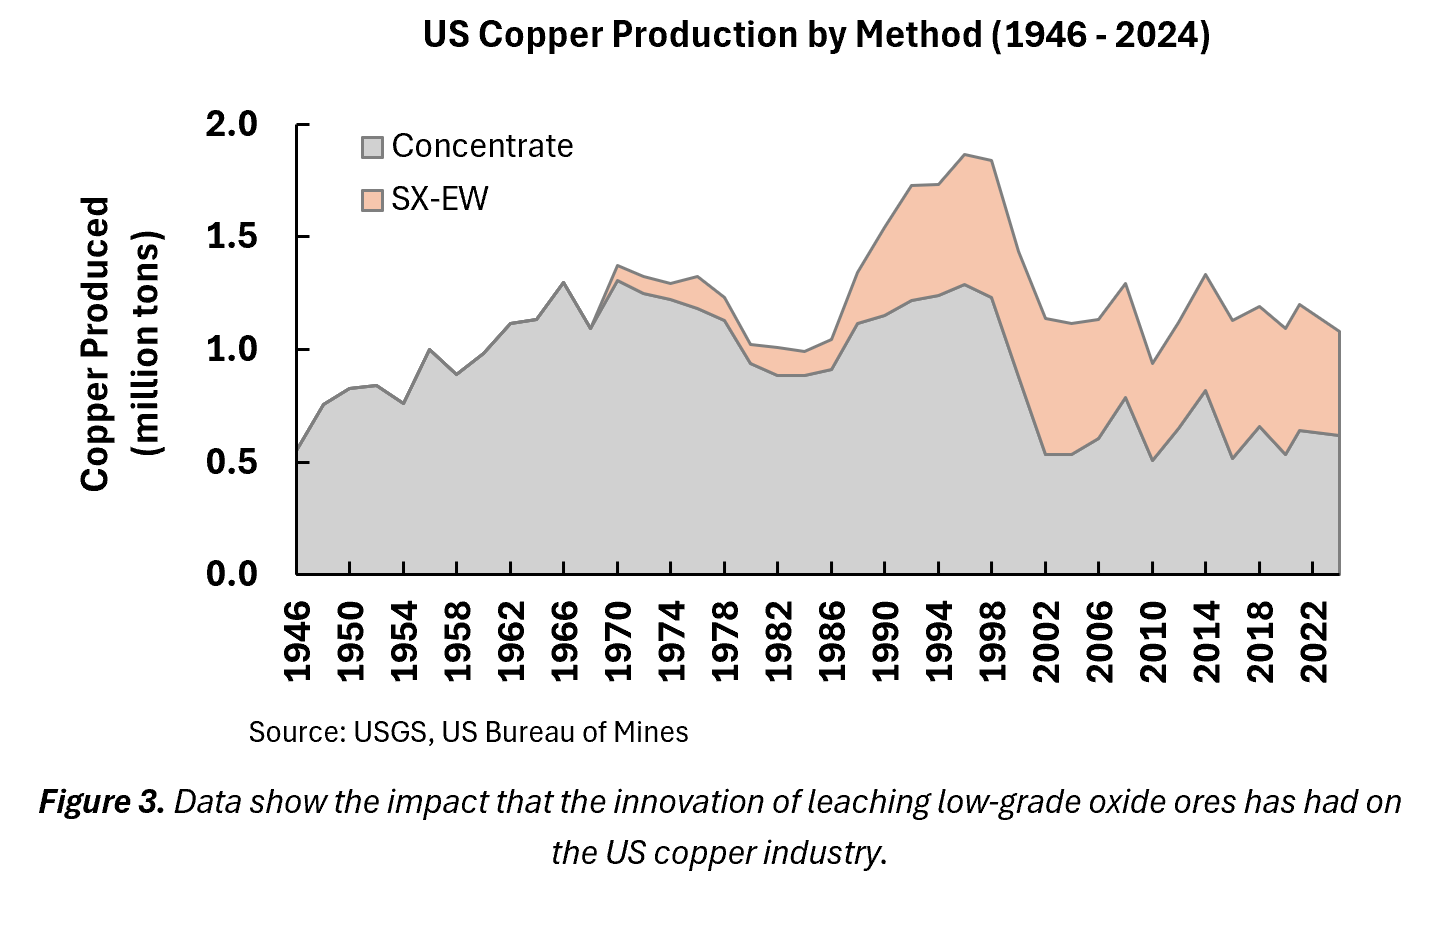 Producing profitably from brownfield sites has become more difficult, though, negatively impacting the ability to maintain and/or grow production at those mines. Productivity gains within the industry have waned in recent years. Unless reversed, we expect this trend to negatively impact operational profitability, and by extension, the ability to convert uneconomical ores and stockpiles into reserves at these sites. Many have reported on how declining ore grades impact production costs. Less discussed is how successful the industry has actually been in managing down production costs over time (Jara et al., 2010). All else equal, if productivity gains outpace the inflationary behavior at a mine, costs can stay low. MinEx Consulting’s 2010 presentation shows that, on average, the industry has historically been able to do this. Cost reductions are attributed to various innovations implemented at mine sites across time, including Wilfley tables for gravity separation (1895), froth flotation (1910), the 100x increase in drilling rates (1907-2005), the 18x growth of the capacity of hauling trucks (since 1960s), more general economies of scale since the post-war period, and solvent extraction-electrowinning (1980s) (Humphreys, 2019). It is important to stress that innovations that reduce production costs also increase the amount of material a company can produce economically at a site. Solvent extraction-electrowinning (“SX-EW”) is a strong example of that. It enabled the efficient processing of previously uneconomical low-grade oxide ores at existing sites. In Figure 3, we use USGS data to show the dramatic effect it had on US copper production, which was in decline for years through the 1970s.
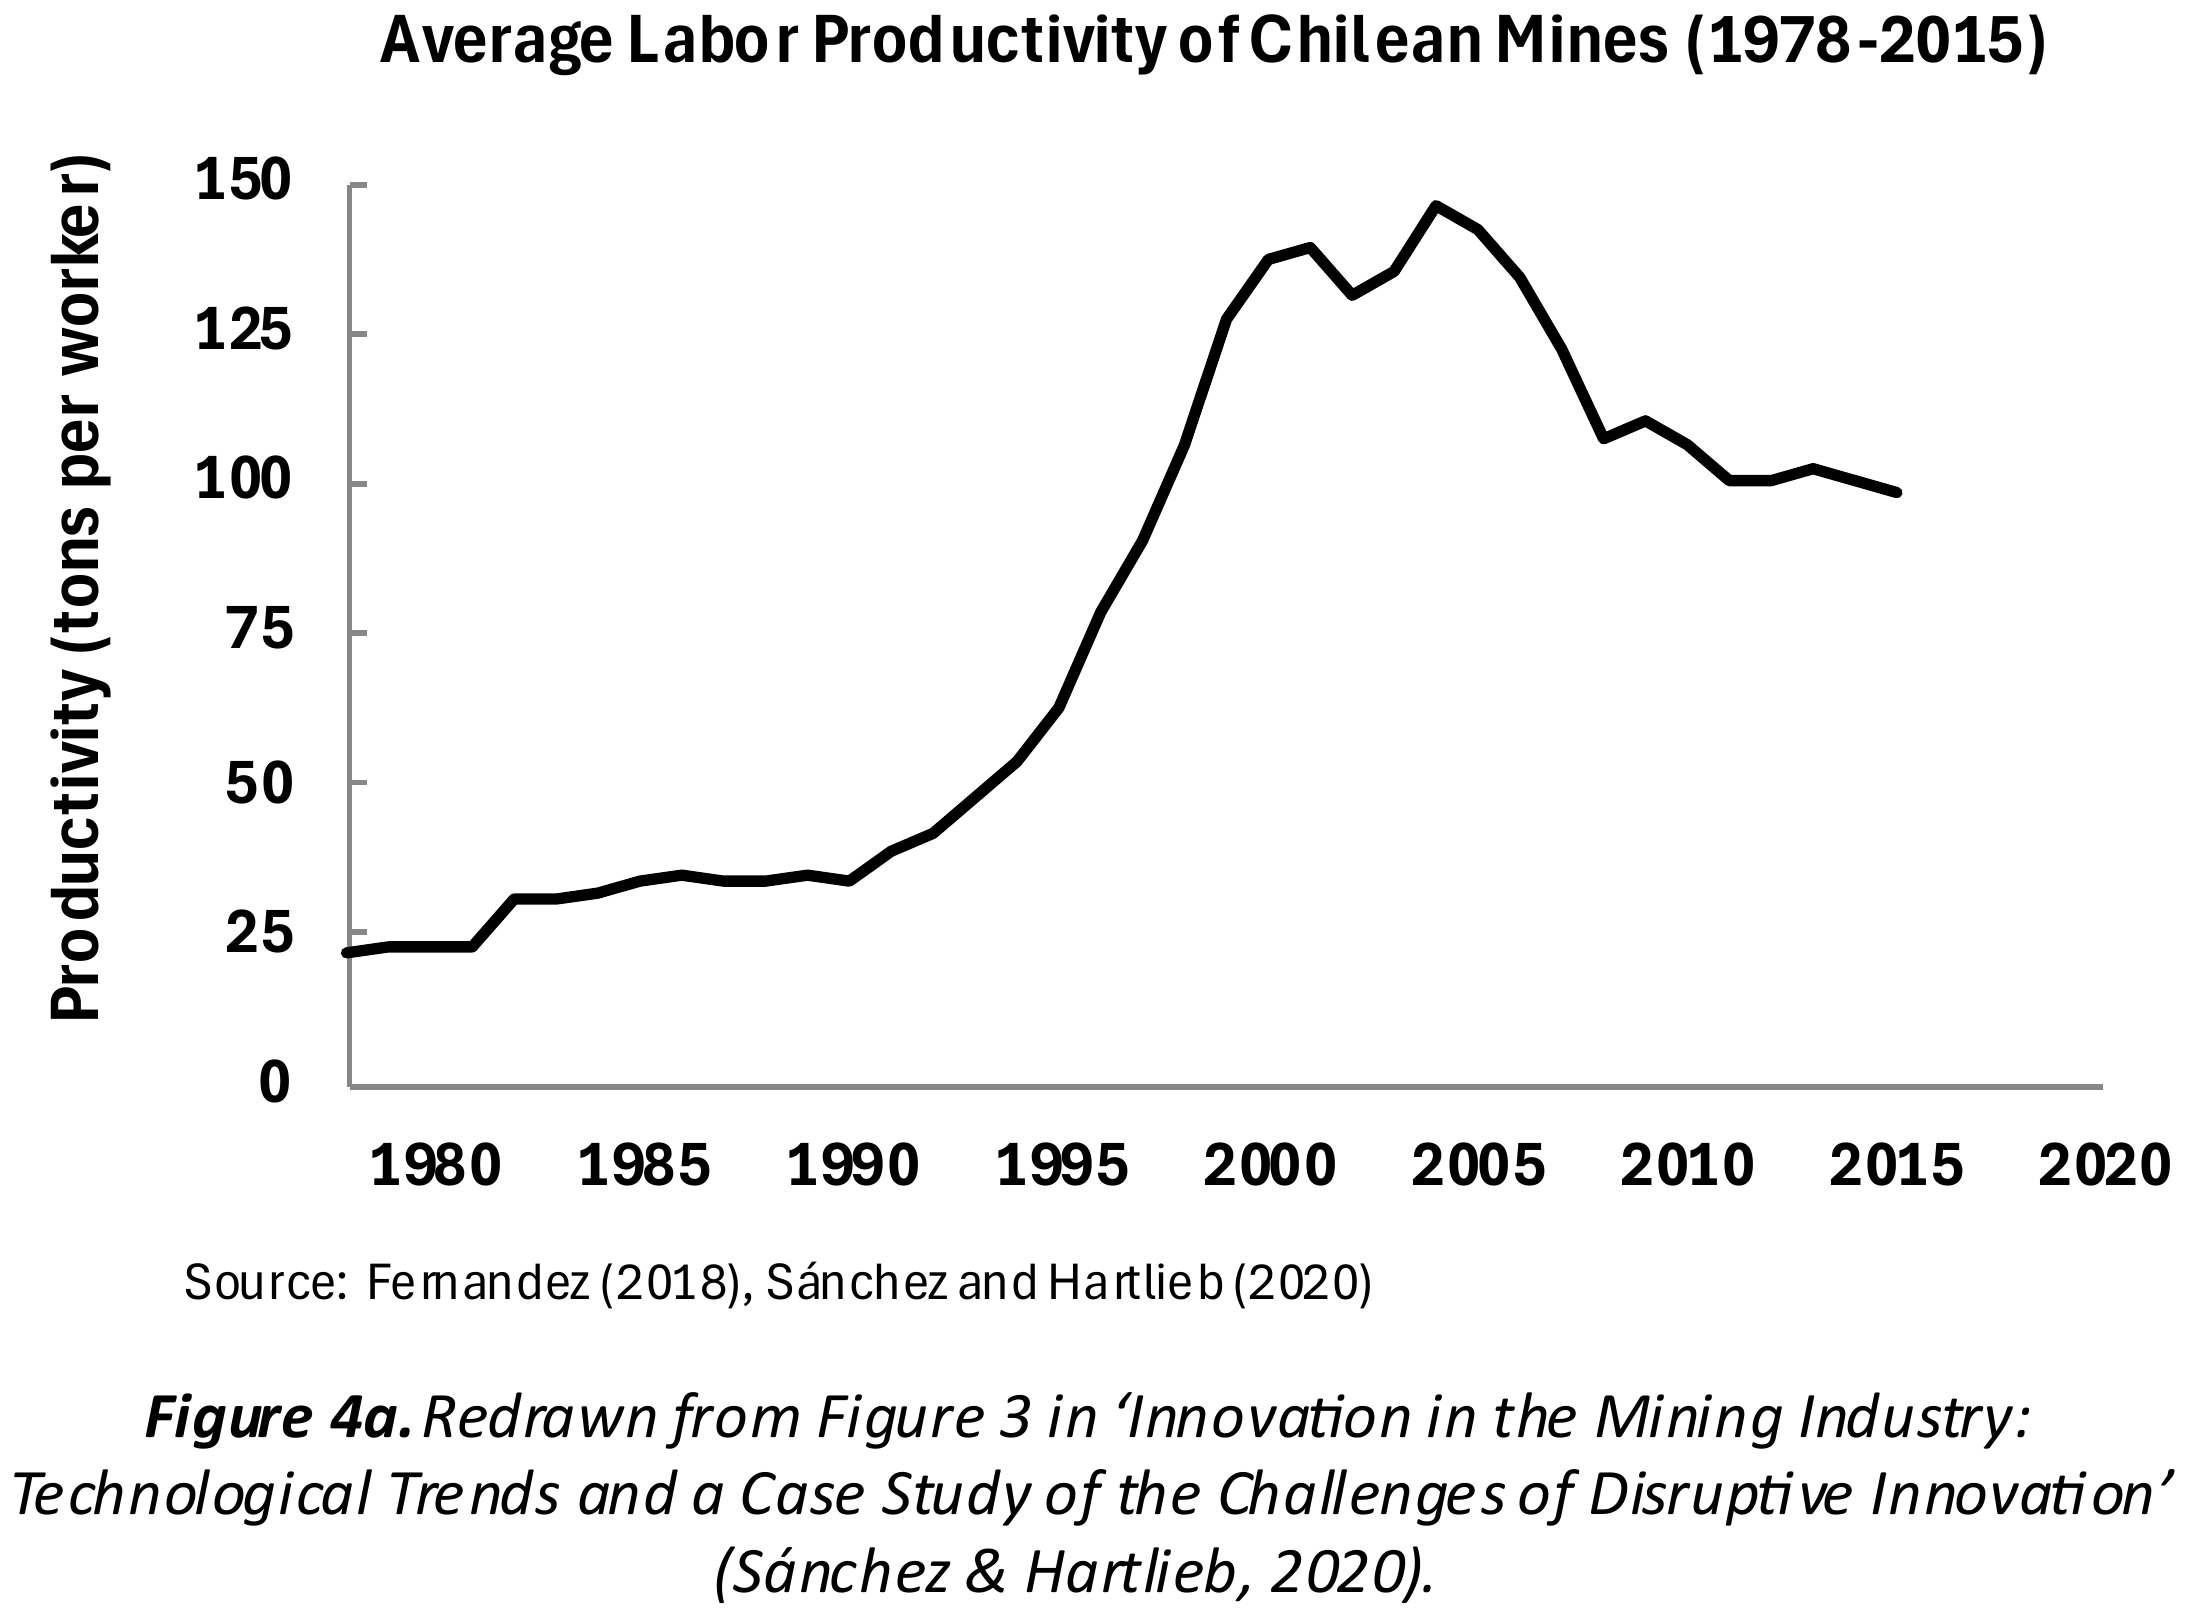
As we noted earlier, though, productivity gains have ceased, and there appears to be a secular shift reflecting the exhaustion of gains from the previous waves of innovation. Data from Chile, Peru, the US, Australia, and Canada, which together constitute ~45% of global copper production, show what is likely to be a broader industry dynamic (Aydin, 2018; Humphreys, 2019; Sanchez & Hartlieb, 2020). Figure 4 illustrates this, specifically, for Chile and the US through ~2015.
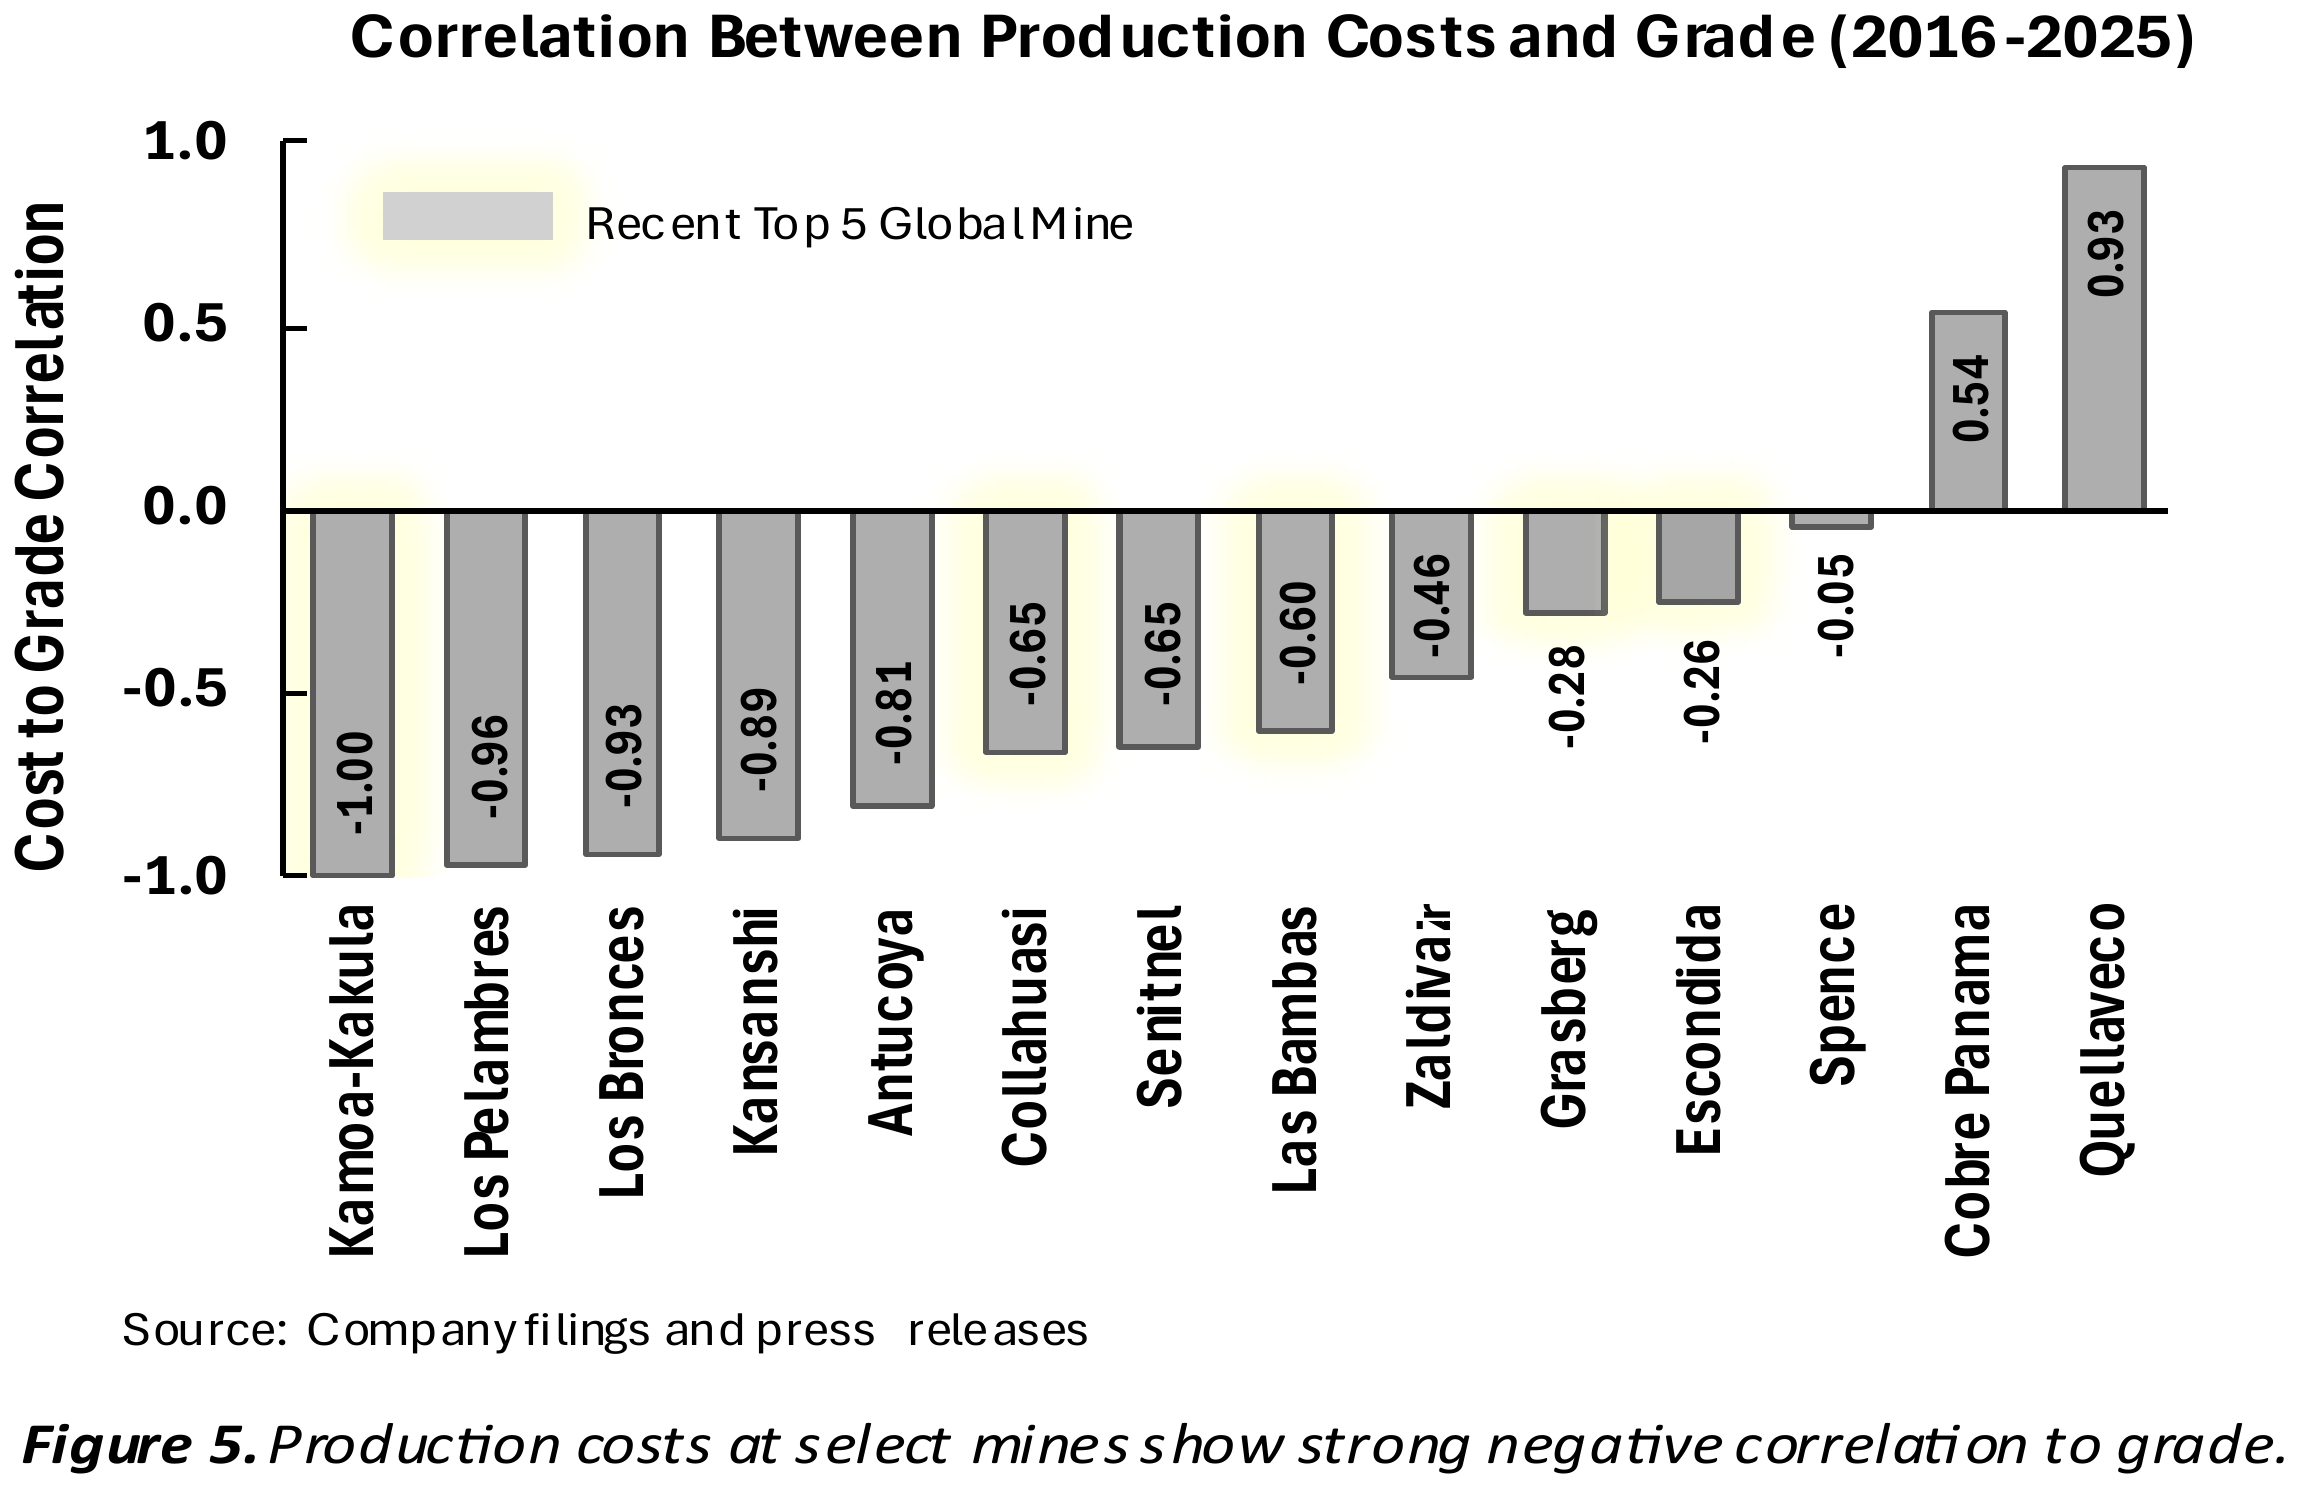
While conversations with some of the authors of the papers cited above confirm that no material reversals have occurred since publication, we wanted to analyze how tightly production costs have correlated with grade declines since then. We examined the relationship between ore grade and production costs and tracked the general operating history of ~15 mines responsible for ~25% of global production3,4. The sample set also covers four of the top five mines by production over the past few years. In Figure 5, we show a nontrivial negative correlation across most mines, indicating that operations will continue to move up the cost curve, compressing margins, unless new productivity interventions are employed. Critical, long-producing mines like Escondida and Grasberg have shown the ability to better manage unit costs over the past decade through effective mine planning and by transitioning to new zones, respectively. We view these as harbingers. Not shown in the graph are new efforts being implemented at other sites to effect change, including coarse-particle flotation and novel leaching techniques. While there are limits to how much miners can fight escalation, our takeaway from the analysis is that there are still ways to reduce the strength of the correlation between grade and costs. In Part 3, we examine further why and how this can be done.
Conclusion. While greenfield opportunities exist and are critically important, structural barriers make accessing supply from new discoveries particularly challenging, reflecting a long-term trend in the copper sector. The increased risk with greenfield developments has led the industry to invest more capital into brownfield sites, though these are not without their own long-running issues. We argue that the next supply wave points to a need for innovations that can deliver step-change productivity gains to help the industry meet the demand call. We examine this in Part 3 of the series.
- The authors calculate a 7.4% median IRR for exploration in Table 6 of the publication and presume an 8% cost of capital for all base case assessments. We separately calculated the median and average industry WACC. This was done with data from Aswath Damodaran’s website. It was ~9% during the period 1998-2008, which represents the second half of the study’s data set. ↩
- Or, in the case of junior miners, it is increasingly “directed toward development rather than exploration” (S&P Global, 2026). ↩
- Production costs are reported differently by miners. We control for these variances, adjusting unit costs to ensure they represent only the cost of producing copper from the ore, exclusive of cost adders sometimes included like transportation, royalties, etc., as well as adjustments for items like by- or co-products. More information and data available upon request from author. ↩
- Mines analyzed from 2016-2025, unless otherwise noted: Escondida, Grasberg, Kamoa-Kakula (’22-’25), Las Bambas, Collahuasi, Los Bronces, Quellaveco (’22-’25), Los Pelambres, Antucoya, Zaldívar, Cobre Panama (’19-’23), Kansanshi, Sentinel, and Spence. Cumulatively, these mines cover ~25% of global production capacity. ↩